Insight
Container throughput is shifting, but volume is not productivity
FY2025-26 data show markedly different trajectories across Chattogram’s principal container facilities, shaped by vessel allocation, equipment condition, infrastructure and the entry of new capacity.
Bangladesh’s container-handling system is entering a period of structural adjustment.
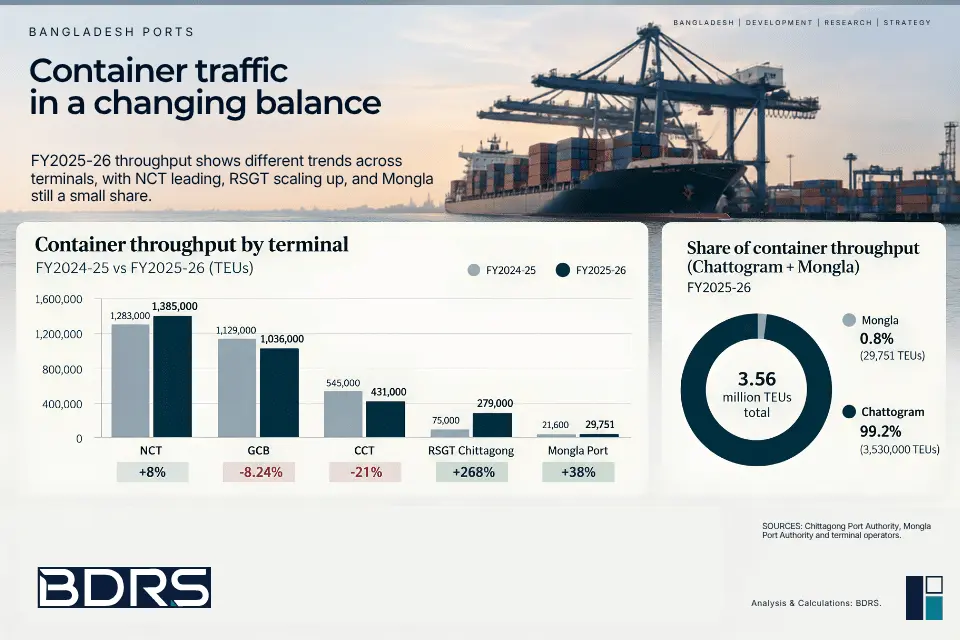
Chattogram Port remains the centre of the country’s containerised maritime trade, but traffic is no longer moving uniformly across its principal facilities. The FY2025-26 figures show NCT strengthening its position, GCB handling less volume, CCT facing operational pressure from ageing equipment and Patenga moving rapidly through its early commercial phase. Data obtained from the Chittagong Port Authority and terminal operators show that New Mooring Container Terminal, or NCT, handled about 1.385 million TEUs during FY2025-26. General Cargo Berth, or GCB, handled around 1.036 million TEUs. Chittagong Container Terminal, or CCT, handled about 431,000 TEUs, while RSGT Chittagong at Patenga handled approximately 279,000 TEUs.
Compared with the previous fiscal year, NCT’s throughput increased by about 8 percent. GCB’s fell by 8.24 percent and CCT’s by roughly 21 percent. RSGT Chittagong increased from about 75,000 TEUs to around 279,000 TEUs, an increase of approximately 268 percent. The significance lies less in the ranking than in the different forces producing those movements.
NCT is an established dedicated container terminal operating with shore-based equipment. GCB works under a different berth and equipment configuration and its operators attribute the fall in volume mainly to vessel allocation. CCT’s decline is associated with ageing gantry cranes and equipment downtime. Patenga is still moving from commissioning towards fuller utilisation. The same headline measure, annual TEUs, is therefore capturing four different operating conditions.
Four terminals, four operating trajectories
The divergence is important because it shows that throughput changes cannot be interpreted through a single explanation.
NCT’s increase is occurring within an established container-terminal configuration. GCB’s operators point to fewer vessel calls allocated to their berths. CCT’s operator points to equipment reliability. Patenga is increasing volume while its operating system and equipment base are still maturing.
Viewed together, the figures show a redistribution of traffic within Chattogram rather than a uniform improvement or deterioration in terminal performance.
NCT is consolidating its position
NCT remained the largest container-handling facility at Chattogram for a fourth consecutive fiscal year. Its throughput rose to approximately 1.385 million TEUs, around 8 percent above the previous year.
The terminal has four dedicated container berths supported by shore-based quay equipment and a layout designed around container flows. This gives NCT an operating configuration suited to relatively concentrated vessel and yard operations. Its sustained lead suggests that container traffic has increasingly gravitated towards dedicated infrastructure. This is an important development in the evolution of Chattogram Port.
Historically, a substantial share of container activity was handled through facilities that were not designed exclusively for containers. The growth of NCT reflects the gradual movement of container operations towards infrastructure built specifically for higher-volume container handling.
The relevant point is not simply that NCT handled the most TEUs. It is that the centre of gravity of container activity has moved towards dedicated terminal infrastructure.
GCB remains large despite lower throughput
GCB handled approximately 1.036 million TEUs in FY2025-26, a decline of 8.24 percent. The facility nevertheless remained the second-largest container-handling area within Chattogram Port. Its operators attribute the decline mainly to fewer vessel allocations. This explanation is consistent with the institutional structure of Chattogram Port, where CPA continues to play an important role in berth and vessel allocation.
GCB operates through six container-handling berths but differs fundamentally from the dedicated terminals. Vessels generally use their own cranes, while yard and landside arrangements are spread across a broader operating area. The facility therefore represents a different operating model rather than simply a smaller version of NCT. Its continued handling of more than 1 million TEUs also demonstrates that legacy infrastructure retains substantial operational importance even as newer dedicated facilities expand.
For port planning, this matters. New capacity is entering a system in which established facilities still handle very large volumes. The strategic question is how those assets should be positioned within the future terminal network.
CCT shows why equipment renewal matters
CCT handled about 431,000 TEUs in FY2025-26, around 21 percent less than in the previous fiscal year. The terminal operator has identified ageing gantry cranes and recurrent downtime as an important operating constraint. CCT therefore illustrates a different aspect of terminal capacity. Port capacity is often discussed in terms of berth length, yard area and theoretical annual throughput. In practice, the productive value of those assets depends on the condition and availability of the equipment connecting ship and terminal. A berth cannot deliver its intended output if critical ship-to-shore equipment is unavailable for extended periods. At CCT, equipment renewal is therefore directly connected to operating capacity. This has broader implications for infrastructure planning. Capital expenditure on new terminals attracts attention because it creates visible additional capacity. The productive life of existing terminals depends just as heavily on replacement cycles, preventive maintenance and timely equipment renewal. In a capital-intensive port system, asset condition is part of capacity management.
Patenga is entering its utilisation phase
RSGT Chittagong recorded the sharpest increase in container handling during FY2025-26. Throughput rose from about 75,000 TEUs to approximately 279,000 TEUs, an increase of around 268 percent. The percentage reflects the terminal’s early commercial stage. Operations began only in June 2024. RSGT operates Patenga Container Terminal under a 22-year concession with CPA, with a stated annual capacity of approximately 500,000 TEUs. At about 279,000 TEUs, the facility reached more than half of its stated annual capacity during FY2025-26. That relationship between actual throughput and installed capacity is more instructive than the percentage growth rate alone.
Patenga is now moving from commissioning towards sustained utilisation. Its importance will increasingly depend on how effectively it converts installed capacity into regular vessel and container flows, and on whether its growth expands Chattogram’s effective capacity or mainly redistributes traffic among existing facilities. Both effects may occur simultaneously.
The entry of a new operator can relieve pressure elsewhere in the port, introduce new equipment and operating practices, and provide additional capacity for future growth. It can also change how traffic is distributed among existing terminals. Patenga therefore represents more than an additional berth complex. It is part of a wider change in Chattogram’s operating architecture.
Mongla is expanding from a small base
Mongla Port handled 29,751 TEUs in FY2025-26, approximately 38 percent more than in the previous year, according to Mongla Port Authority data. Its container volume remains small compared with Chattogram, but the upward movement is relevant in the broader national port system. Chattogram and Mongla serve different cargo bases, hinterlands and shipping patterns. Mongla should therefore be assessed as a complementary seaport rather than as another terminal in the Chattogram ranking. Its future container role will depend on cargo generation in the southwest, industrial investment, inland connectivity, shipping services and the development of associated logistics networks. The current numbers do not suggest an immediate redistribution of national container traffic away from Chattogram. They do indicate that Mongla has scope to deepen its role in selected regional and industrial cargo flows.
For Bangladesh, a more diversified port system does not require every port to perform the same function. It requires each facility to develop around the cargo, geography and connectivity it can serve most effectively.
Throughput should be read in operational context
Annual TEUs remain the most visible measure of terminal activity, but their analytical value improves considerably when placed alongside the conditions under which they were generated. NCT handled about 1.385 million TEUs through four dedicated berths. GCB handled more than 1 million TEUs through six container-handling berths operating under a different equipment model. CCT handled less volume while facing equipment constraints. Patenga recorded rapid growth while moving through its early utilisation cycle. These figures are not directly interchangeable. A high-volume terminal may benefit from concentrated vessel allocation, dedicated equipment and established shipping patterns. A lower-volume facility may still possess significant latent capacity. A new terminal may show exceptional percentage growth while remaining well below mature operating scale.
BDRS therefore evaluates terminal development through four complementary lenses:
Traffic scale: how much container volume the facility handles.
Operating configuration: the relationship between berths, equipment, yards and vessel handling.
Asset readiness: whether installed infrastructure and equipment are available for sustained operation.
Utilisation trajectory: whether a facility is expanding, contracting or moving towards fuller use of its capacity.
This framework provides a more informative reading of the FY2025-26 numbers than a simple ranking by TEUs.
The operating model is becoming more diverse
Chattogram’s container system is also becoming institutionally more varied. Different facilities now operate under different management and contractual arrangements. Domestic operators, berth operators, public-sector management and an international concessionaire coexist within the same port system. This changes the analytical question. The issue is no longer simply whether capacity should be publicly or privately operated. The more useful test is whether each operating model improves reliability, productivity, asset utilisation and service quality. Competition can contribute to that process, but the structure at Chattogram is not based entirely on unrestricted competition for vessel calls. CPA retains an important role in berth allocation.
As a result, performance should be assessed through operational outcomes rather than operator identity alone.
The relevant questions are practical:
How effectively are berths used?
How reliably does equipment operate?
How quickly can vessels complete cargo operations?
How efficiently do containers move from ship to yard and onward to the hinterland?
How much usable capacity does each investment create?
These questions provide a more durable basis for evaluating different management models than institutional labels.
Bangladesh is moving from capacity expansion to capacity optimisation
For much of the past two decades, Bangladesh’s port challenge was relatively straightforward: container traffic was growing faster than terminal capacity. That challenge has not disappeared. What has changed is the complexity of the response. Chattogram now has several major container facilities with different infrastructure, equipment, operating models and levels of maturity. New capacity is entering the system while older facilities continue to handle substantial volumes. Some terminals are expanding, others require equipment renewal, and vessel allocation influences the utilisation of each facility.
The next phase of port development will therefore depend not only on building additional terminals, but also on extracting more productive value from the infrastructure already in place.
That means aligning four elements:capacity investment, traffic allocation, equipment readiness and terminal utilisation.
If those elements move together, additional infrastructure can increase system-wide performance.
If they become disconnected, new capacity can coexist with underused assets elsewhere in the port.
The FY2025-26 data suggest that Chattogram is already entering this transition.
NCT has consolidated its position as the largest container facility. GCB continues to handle more than 1 million TEUs despite lower annual volume. CCT illustrates the importance of equipment renewal. Patenga is moving rapidly towards greater utilisation. Mongla is expanding its container activity from a much smaller base.
These are not isolated developments.
Together they show a port system shifting from a period dominated by capacity creation towards one in which capacity allocation, asset productivity and operating strategy will increasingly determine performance.
For Bangladesh, that is likely to become the central port-management question of the next decade.
Data sources and analytical approach
This analysis is based on container-handling and operational information obtained from Chittagong Port Authority, Mongla Port Authority and the respective terminal operators and operating entities.
CPA data are used for Chattogram Port throughput, terminal and berth information, vessel allocation and related operating information.
Mongla Port Authority data are used for container throughput and operating context at Mongla.
Terminal operators provided or published terminal-level information on throughput, equipment, operating arrangements, capacity and year-on-year changes.
BDRS has used these primary-source data to examine traffic distribution, terminal configuration, capacity utilisation and the changing operating structure of Bangladesh’s container port system.
Percentage changes, utilisation ratios and comparative calculations are BDRS calculations based on the reported figures.
Sources: Chittagong Port Authority, Mongla Port Authority and terminal operators Analysis and calculations: BDRS